Getting Started
The Compose Navigation Graph IDE plugin brings your app's flow graph directly into Android Studio or IntelliJ IDEA. It reads the graph produced by the Gradle plugin and draws it in an interactive NavGraph Graph tool window with three tabs:
- Graph: the whole app's merged flow map, with every destination's rendered thumbnail and typed arguments, the transitions between screens, and a double click to jump straight to the code. See NavGraph Graph.
- Previews: every
@Previewin your project, rendered and grouped by module and package. See Preview Gallery. - Author: a short introduction to the plugin and its author.
Installation
Install the plugin from the JetBrains Marketplace: open Android Studio (or IntelliJ IDEA) > Settings > Plugins > Marketplace, search for Compose Navigation Graph, and click Install. Restart your IDE when prompted.
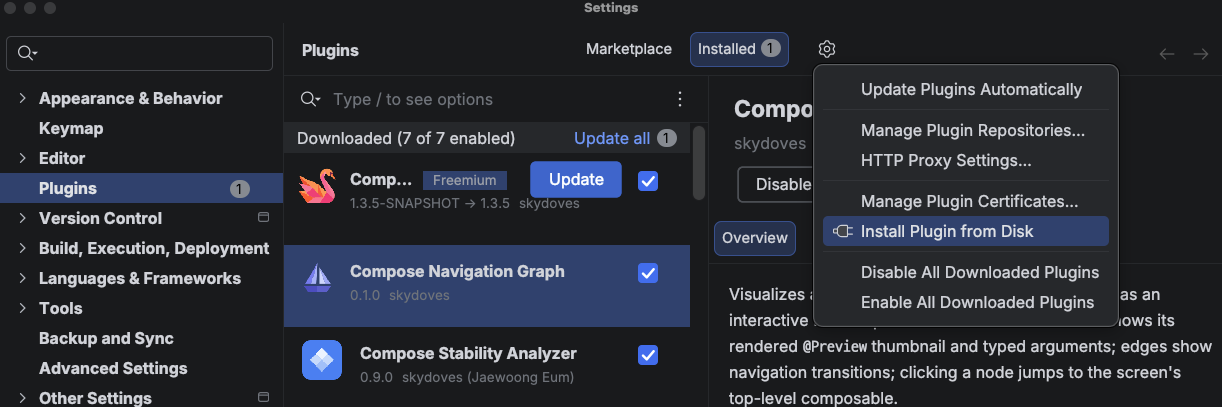
If you prefer a specific build, you can also install from disk:
- Download a
compose-nav-graph-idea-*.zipfrom the releases page. - Open Settings > Plugins > click the ⚙️ gear icon > Install Plugin from Disk….
- Select the downloaded zip and restart your IDE when prompted.
Prerequisites
The IDE plugin draws the graph; the Gradle plugin produces it. So before the tool window can show anything, your project needs the Gradle plugin applied and the graph generated:
./gradlew :app:generateNavGraph
This writes build/navgraph/nav-graph.json (and thumbnails), which the tool window reads. If the plugin can't find a generated graph, the tool window shows a short setup guide with a one click link instead of a blank panel.
Refresh runs Gradle for you
You don't have to run the Gradle task by hand each time. By default, the Refresh button in the tool window runs generateNavGraph itself and reloads the result, so you can stay in the IDE. (This is configurable. See Settings.)
Set everything up in one shot with AI
Paste plugin-agent-guides.md into your LLM (Claude Code, Cursor, Gemini CLI, ...) as-is, and it will apply the Gradle plugin, annotate your screens, and generate your first graph for you.
Open the Tool Window
Open View > Tool Windows > NavGraph Graph (the tool window is anchored on the right side of the IDE by default). Click it to open the panel, then press Refresh to generate and load your graph.
Once loaded, the Graph tab shows your app's flow map: nodes for each destination, curved arrows for the transitions, and a highlighted start node. From here you can pan, zoom, double click a node to jump to its source, and drag a connector to add a new transition. See NavGraph Graph for everything the Graph tab can do, and Preview Gallery for the Previews tab.