Overview
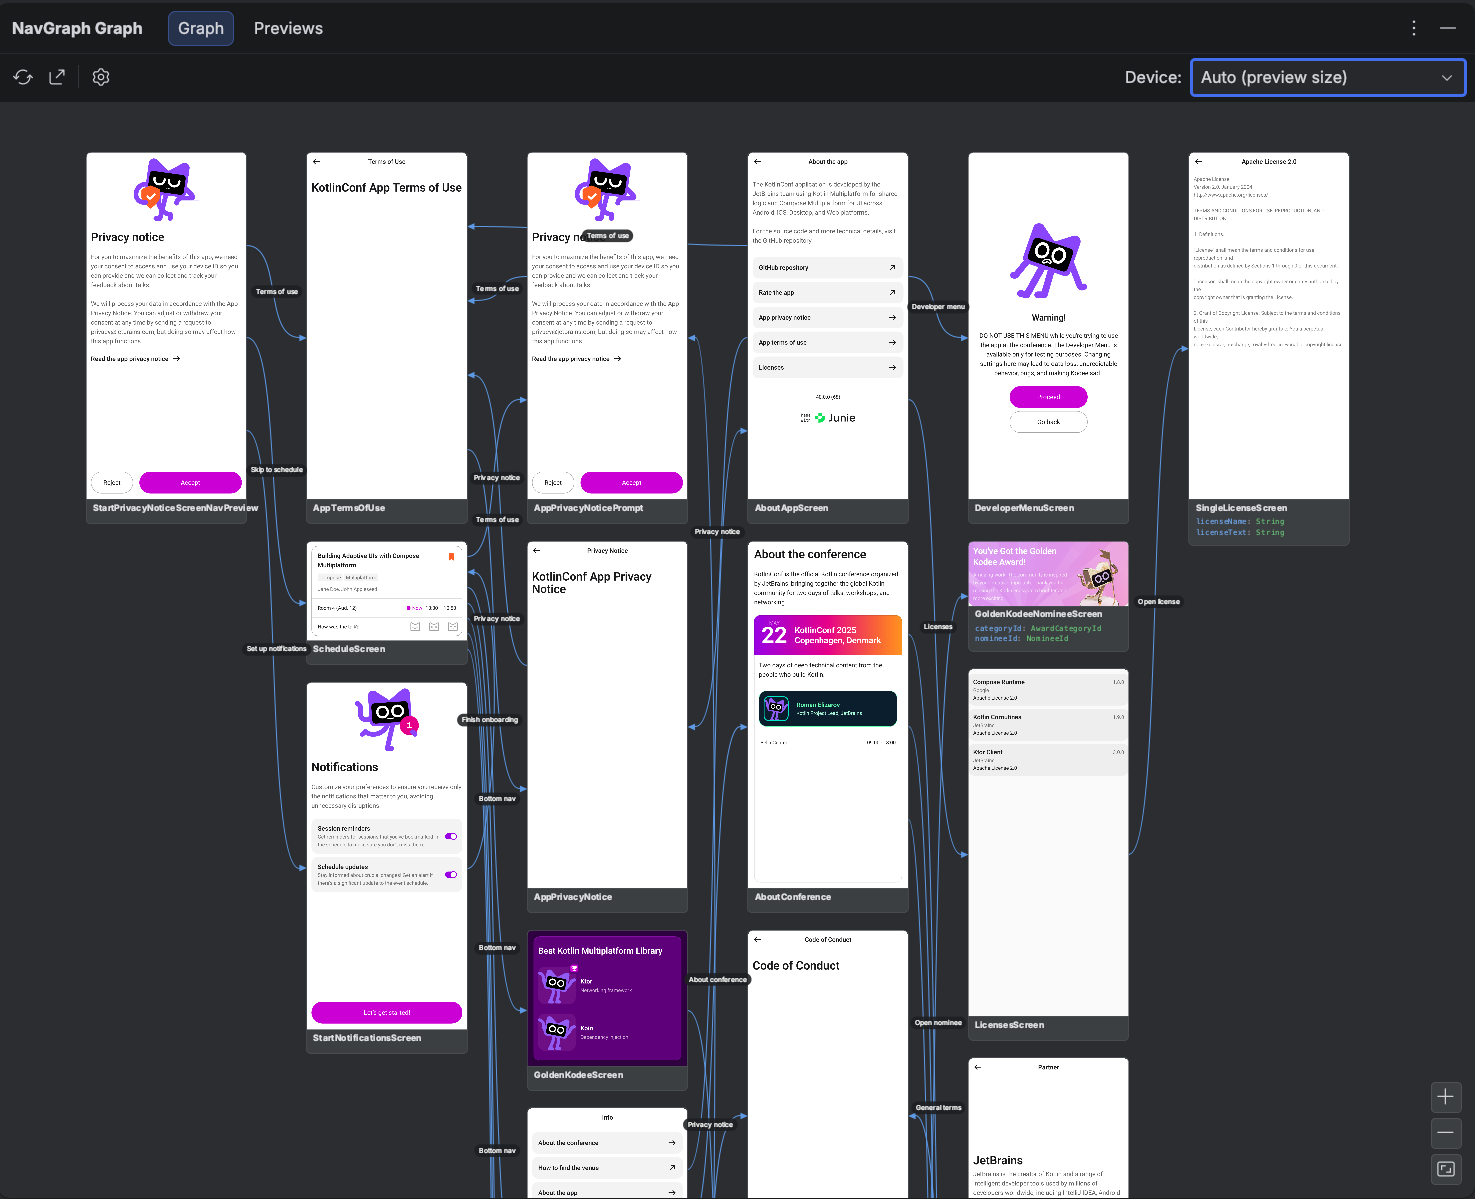
Compose Navigation Graph turns your Jetpack Compose app into an interactive flow graph: Navigation 3 destinations are picked up automatically, and anything else wires in through the same annotations, from Navigation 2 routes to plain Activities. You annotate your screens, run a single Gradle task, and a complete map of your navigation appears as a tool window in Android Studio or IntelliJ: every destination, its typed arguments, the transitions between screens, and a rendered thumbnail of each screen. A committed .nav baseline can also validate navigation changes in pull requests, so no destination or transition changes unreviewed.
It follows the same "make the invisible visible" idea as Compose Stability Analyzer: navigation in Compose is imperative code scattered across entry<Route> { Screen() } lambdas and backStack.add(...) call sites, so there is no single place to see the shape of your app. This toolkit reconstructs that shape statically, at build time, with no emulator and no connected device, and draws it for you.
New here? Start with the walkthrough
For a guided tour of the whole toolkit, read Compose Navigation Graph: Visualize Your Entire App Flow in Android Studio on Dove Letter.
Set everything up in one shot with AI
Throw plugin-agent-guides.md at your LLM (Claude Code, Cursor, Gemini CLI, ...) as-is, and it will apply the Gradle plugin, annotate your screens, and generate your first graph for you.
Components
The toolkit is made of four cooperating pieces. You typically apply the Gradle plugin (which pulls in the annotations and KSP processor automatically) and install the IDE plugin.
| Component | Purpose | Integration |
|---|---|---|
Gradle plugin (com.github.skydoves.navgraph) |
Wires up the build, runs the extraction + Layoutlib rendering, and registers the nav tasks | Apply to your app / feature module's build.gradle.kts |
KSP processor (com.github.skydoves:compose-nav-graph-ksp) |
Statically reads the annotations at compile time and emits each module's nav-graph.json |
Added automatically by the Gradle plugin |
Annotations (com.github.skydoves:compose-nav-graph-annotations) |
@NavDestination, @NavEdge, @NavPreview, @NavGraphRoot describe your graph |
Added automatically by the Gradle plugin |
IDE plugin (compose-nav-graph-idea) |
The NavGraph Graph tool window: the whole app's merged flow graph plus a preview gallery, with thumbnails, click to source, and add transition | Install from the JetBrains Marketplace |
They work together
The Gradle side produces the data (build/navgraph/nav-graph.json plus thumbnail PNGs); the IDE side reads it and draws it. The Gradle plugin is also useful on its own. You can export the graph to HTML or PNG, or gate pull requests on navigation changes, without ever opening the IDE plugin.
Quick Start
1. Apply the Gradle plugin
In your app (or feature) module's build.gradle.kts, apply the navgraph plugin alongside KSP:
plugins {
    id("com.google.devtools.ksp") version "<ksp-version>"
    id("com.github.skydoves.navgraph") version "0.2.0"
}
The plugin auto adds compose-nav-graph-annotations and compose-nav-graph-ksp for you, so there are no dependencies to declare.
2. Annotate one screen
Mark the composable that renders a destination, link a preview so it gets a thumbnail, and (optionally) declare where it can navigate:
@NavGraphRoot(route = Feed::class)
@NavDestination(route = Feed::class)
@NavEdge(to = Profile::class, label = "open profile")
@Composable
fun FeedScreen() { /* … */ }

@NavPreview(route = Feed::class, primary = true)
@Preview
@Composable
fun FeedScreenPreview() {
    FeedScreen()
}
3. Generate the graph
./gradlew :app:generateNavGraph
This extracts the graph, renders the @NavPreview screens to device free thumbnails, merges every module, and writes build/navgraph/nav-graph.json.
4. Open the NavGraph Graph tool window
Install the IDE plugin from the JetBrains Marketplace, then open View > Tool Windows > NavGraph Graph. Your app's flow map appears in the Graph tab. Pan, zoom, double click a node to jump to its source, and drag a connector to add a new transition. The Previews tab renders every @Preview in your project as a Preview Gallery.
Why Use This?
Navigation 3 makes navigation explicit and type safe, but it also spreads the structure of your app across many files: a NavKey here, an entry<Route> { } there, a backStack.add(...) somewhere in a click handler. The same is true of Navigation 2 routes and Activity hops. There is no built-in way to answer simple questions like "what can I reach from here?", "which screen owns this argument?", or "did this refactor change the app's flow?"
This toolkit answers them by reconstructing the graph from annotations and showing it visually. Because the extraction is static and the thumbnails are rendered with Layoutlib (the same engine Android Studio uses for @Preview), the whole thing runs at build time: no emulator, no running app, no device. It works across Kotlin Multiplatform and multi module projects, merging every module's contribution into one graph.
It's a map, not a rulebook
The annotations describe your navigation for visualization and review; they don't change how your app actually navigates. You keep writing your navigation code as before, whether that's Navigation 3, Navigation 2, or plain Activities. Add the annotations where you want the graph to be richer (a thumbnail here, an explicit edge there), and the picture fills in.
See Real Generated Output
Curious what the generated artifacts actually look like on real apps? The nav-results/ directory contains committed exports from real-world projects (the KotlinConf app, Now in Android, and SimpMusic): full navigation graph PNG exports under nav-results/nav-graphs/ and preview galleries under nav-results/preview-gallery/.